Whether you're managing an in-house team or evaluating a BPO partner, each metric answers a fundamentally different question. Occupancy tells you what's happening on the floor right now. Utilization tells you how efficiently you're deploying labor across the entire paid shift. Understanding where one ends and the other begins is what separates reactive headcount decisions from strategic workforce planning.
Key Takeaways
- Occupancy measures the share of logged-in queue time agents spend on contact-related tasks (talk, hold, and after-call work)
- Utilization captures all productive work time — calls, training, meetings, and admin tasks — as a share of the total paid shift
- The occupancy formula:
Total Handling Time ÷ (Total Handling Time + Available Time) × 100 - Most industry practitioners target occupancy around 85% as a ceiling; above that, burnout and quality decline follow
- High utilization paired with low occupancy is a red flag: agents are busy, but not with your customers
- Neither metric belongs on an individual agent scorecard; both are operations management tools
Occupancy vs. Utilization: Quick Comparison
| Dimension | Occupancy | Utilization |
|---|---|---|
| What it measures | Contact-handling intensity during queue time | Productive work time across the full paid shift |
| Time base | Logged-in (in-queue) time only | Total scheduled shift time |
| Includes training/meetings? | No | Yes |
| Primary use case | Intraday staffing, real-time schedule management | Capacity planning, budgeting, BPO vendor evaluation |
| Target benchmark | ~85% ceiling (most practitioners) | ~85% (per industry guidance) |
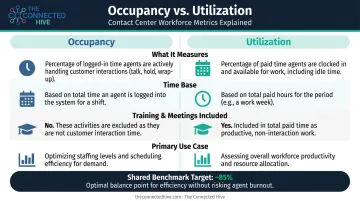
The core conceptual difference is a matter of scope. Occupancy captures what happens while agents are queued and available for contacts. Utilization covers the entire paid shift — including time in training, meetings, and administrative work.
An agent can show high utilization and low occupancy at the same time. That typically means a significant portion of their shift is spent in non-queue activities — legitimate work, but work that reduces live queue coverage when demand is high.
What Is Call Center Occupancy?
Occupancy is the percentage of an agent's logged-in, in-queue time spent actively handling contacts — specifically talk time, hold time, and after-call work (ACW). The remaining in-queue time is idle waiting time between calls. It's a workforce management metric, not an individual performance score.
The Occupancy Formula
Occupancy (%) = Total Handling Time ÷ (Total Handling Time + Available Time) × 100
Example: An agent logs 300 minutes of handle time and 60 minutes of idle time during a 6-hour in-queue window.
300 ÷ (300 + 60) × 100 = 83.3% occupancy
At 83.3%, the agent is productively engaged without the recovery-time deficit that drives errors and fatigue.
What High Occupancy Signals
When occupancy climbs above 85–90%, agents have little or no recovery time between contacts. Research from Call Centre Helper documents that beyond the 85% threshold, agents begin extending calls or staying in ACW longer just to create a brief pause — a symptom of fatigue, not inefficiency. The downstream consequences include higher error rates, declining quality scores, and accelerated turnover.
The turnover cost is not trivial. McKinsey reports annual contact center attrition of up to 60%, with replacement costs running $10,000–$20,000 per agent once recruitment, training, and ramp-up productivity loss are factored in.
What Low Occupancy Signals
Occupancy below 65–70% typically points to one of three problems:
- Overstaffing relative to actual call volume
- Inaccurate forecasting that scheduled too many agents
- Fragmented queue design that leaves agents sitting idle in underloaded queues
Since labor is the largest line item in any contact center budget, consistently low occupancy is a direct hit to cost efficiency.
One boundary worth keeping in mind: occupancy does not include training sessions, team meetings, or administrative tasks — those fall under utilization, which is where most of the confusion between the two metrics begins.
Use Cases for Occupancy
Occupancy is primarily an intraday workforce management tool. Managers use it to:
- Spot "dead zones" within a shift where agents sit idle waiting for volume that never arrives
- Trigger off-phone tasks — training modules, administrative work — during predictably low-volume windows
- Adjust real-time staffing levels when call arrival patterns deviate from forecast
Healthcare contact centers handling member enrollment are a prime example. Seasonal volume spikes during open enrollment create intense pressure, and tight occupancy monitoring during those peak periods prevents burnout without locking in staffing levels that become wasteful the rest of the year.
What Is Call Center Utilization?
Utilization captures the ratio of all productive work time to an agent's total scheduled shift. Unlike occupancy, it covers everything an agent does during paid hours — calls, training, meetings, and all.
The Utilization Formula
Utilization (%) = Total Logged-In (Active) Time ÷ Total Shift Time × 100
Total shift time excludes paid breaks, unplanned absences, and the gap between an agent arriving and logging in. Those losses fall under shrinkage — the portion of scheduled time when agents are paid but genuinely unavailable for customer work. Shrinkage is a related but separate metric that acts as a drag on utilization.
The Scenario That Illustrates the Gap
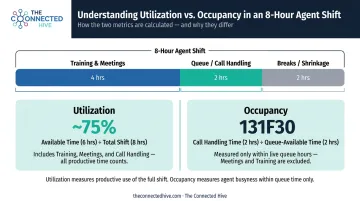
Consider an agent with an 8-hour shift:
- 4 hours in training and team meetings
- 2 hours queued and handling calls
- 2 hours in breaks/shrinkage
Their utilization may read close to 75% (6 of 8 active hours accounted for). Their occupancy, calculated only against the 2-hour queue window, may be quite high or quite low, depending on call volume during those hours. Both figures are accurate. Neither can substitute for the other.
What Utilization Reveals That Occupancy Cannot
- Tracks labor efficiency across the full working day, not just active queue time
- Quantifies the budget cost of training and meetings relative to call-handling capacity
- Flags whether off-phone activities are eating into peak hours when customers need coverage most
This makes utilization the more relevant metric for budgeting, capacity planning, and evaluating BPO vendor contracts. A partner's utilization report shows how much paid-for agent time actually reaches your customers versus disappears into their internal operations.
Use Cases for Utilization
Operations leaders use utilization for decisions with longer time horizons:
- Determines whether current headcount can absorb a new program or product launch
- Quantifies how many call-handling hours a training initiative will consume
- Identifies whether unplanned absence or schedule adherence is steadily eroding available capacity
- Holds BPO partners accountable for how paid-for agent time is actually deployed
Occupancy vs. Utilization: What's the Real Difference and Why It Matters
The simplest reframe: occupancy asks how busy agents are on the floor, while utilization asks how efficiently you're deploying their entire paid day. One is a real-time operations lens; the other is a strategic planning lens.
The "High Utilization, Low Occupancy" Warning Sign
Agents can be fully utilized — attending training, in project meetings, completing off-phone tasks — while posting low occupancy during their actual queue time. This pattern often means:
- Non-contact activities are being scheduled during peak call hours
- Too many agents are being pulled off the floor simultaneously
- The center is structurally understaffed for its queue demand, even if total labor hours look healthy on paper
The Inverse: High Occupancy, Low Utilization
The reverse pattern is equally telling. Agents intensely busy on calls but with large unaccounted gaps in their shift typically signals shrinkage problems or schedule adherence failures. Agents may be on the phones when logged in, but logged out far more than planned.
The Customer Experience Connection
When occupancy stays above 85–90% for extended periods, customers reach agents who are fatigued, rushed, and less capable of delivering thoughtful service. Practitioner research from Call Centre Helper documents declining CSAT scores, lower internal quality results, and reduced engagement at sustained high-occupancy levels. The data is consistent, even if the precise threshold varies by center type.
Why This Matters When Evaluating Outsourced Partners
A BPO vendor who only surfaces utilization figures in their reporting may be masking low queue-time occupancy. In practice, that means agents aren't engaging with your customers as much as the headline number implies — and you may be paying for scheduled hours that quietly drain into internal overhead rather than queue work.
The Connected Hive's vendor vetting process covers RFP/RFI development, site visit audits, and performance data review — specifically designed to surface these gaps before they become contractual headaches. Tim Austrums has spent twenty years on both sides of BPO contracts and knows exactly which follow-up questions reveal whether reported utilization reflects genuine queue engagement or padded internal overhead.
How to Improve Occupancy and Utilization in Your Call Center
Optimizing Occupancy Without Burning Out Agents
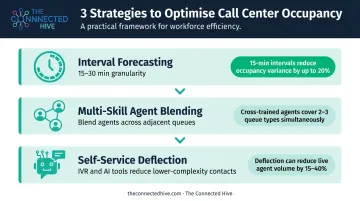
- Refine interval forecasting — NiCE recommends forecasting at 15- or 30-minute granularity rather than hourly blocks. Hourly forecasts smooth over the spikes and valleys that drive occupancy out of range at the intraday level.
- NiCE data shows 84% of contact centers skill agents for 4–8 competencies, but roughly half queue them for only 1–3 at a time. Blending agents across adjacent queues during idle periods absorbs excess capacity without hiring.
- Deploy self-service tools — AI voice assistants and IVR deflection reduce inbound volume on lower-complexity contacts, preserving agent capacity for interactions where human judgment matters. McKinsey reported one AI voice deployment reduced billing call volume by roughly 20% at a major energy company.
Improving Utilization
- Audit training and meeting schedules against call volume patterns. Off-phone time scheduled during peak hours directly reduces available capacity when it's most needed.
- Measure and reduce shrinkage actively: track unplanned absence and schedule adherence as discrete metrics, not folded into aggregate utilization figures.
- Formally log all off-phone work. Utilization numbers built on incomplete activity data will consistently misrepresent true capacity.
A Critical Caution
One more thing before you start adjusting targets: neither occupancy nor utilization belongs on an individual agent's performance scorecard. Agents don't control call arrival rates, queue depth, or training schedules. Holding them accountable for metrics that are outside their influence drives exactly the disengagement and attrition these metrics are designed to prevent.
Frequently Asked Questions
What is occupancy at a call center?
Call center occupancy is the percentage of an agent's logged-in queue time spent on contact-related activities — talk time, hold time, and after-call work — versus idle waiting time between calls. It's used to assess whether staffing levels are appropriately matched to call demand, not to evaluate individual agents.
What is a good occupancy rate for a call center?
Most practitioners recommend not exceeding 85% occupancy. Above that threshold, agents begin showing signs of fatigue, quality declines, and attrition risk increases. Rates below 65–70% typically signal overstaffing or significant forecasting inaccuracies.
How do you manage occupancy in a call center?
Four primary levers move the needle on occupancy:
- Interval-level workforce forecasting (15- or 30-minute increments)
- Multi-skill agent blending across queues
- Real-time intraday schedule adjustments
- Self-service tools that deflect lower-complexity contacts during high-demand periods
What is the difference between occupancy and utilization in a call center?
Occupancy only counts time while agents are logged in and available in the queue. Utilization counts all paid time, including training, meetings, and off-phone tasks. Occupancy is a real-time staffing tool; utilization is a long-term capacity planning and vendor accountability metric.
Does occupancy include after-call work (ACW)?
Yes. ACW — the documentation and wrap-up time immediately following a contact — is included in most occupancy calculations because it's directly tied to handling that customer interaction. Centers should apply this consistently, as some calculate occupancy both ways.
What is a good utilization rate for a call center?
Industry guidance from Call Centre Helper cites 85% as a reasonable utilization target. Rates well above that level risk eroding agent culture and driving attrition, which is why planned time for training and coaching should be built into every shift schedule.