ASA is one of the most closely watched KPIs in any contact center because it sits at the intersection of customer experience, agent efficiency, and operating costs. A high ASA signals that something is breaking down — understaffing, poor routing, or agents buried in long handle times. A low ASA that's too low signals waste.
This guide covers what ASA is, how to calculate it, what benchmarks actually mean, and the most effective strategies to bring it down without overspending to get there.
Key Takeaways
- ASA measures queue wait time only — it starts when a caller enters the queue, not when they first dial in
- The widely cited industry benchmark is ~28 seconds, but this varies significantly by sector
- High ASA signals understaffing, poor routing, or excessive handle times — all of which damage CSAT
- Very low ASA can indicate overstaffing and inflated cost per interaction
- Sustainable improvement comes from smarter routing, better forecasting, and consistent real-time monitoring
What Is Average Speed of Answer (ASA)?
ASA measures the average time it takes for an agent to answer an inbound call after the caller enters the queue. That "after entering the queue" part matters — ASA does not include the time a caller spends navigating IVR menus or being transferred between departments. It starts the clock from the moment they're in line waiting for a live agent.
This distinction trips people up. A caller might spend 90 seconds working through an IVR before reaching the queue, then wait another 35 seconds for an agent. ASA only captures those 35 seconds. The full pre-answer experience is longer, but ASA is a specific, narrowly defined measurement.
How ASA differs from Average Handle Time (AHT):
- ASA = time in queue before the call is answered (pre-connection)
- AHT = total time an agent spends on the call, including talk time and after-call work (post-connection)
The two are linked. When agents spend more time per call, they're unavailable longer — which means the next caller waits longer, pushing ASA up. Reducing AHT is one lever for improving ASA.
How ASA Fits Into the Broader KPI Ecosystem
ASA doesn't operate in isolation. It's closely tied to three other key metrics:
- Service Level — the percentage of calls answered within a target time threshold (e.g., 80% within 20 seconds)
- Call Abandonment Rate — the percentage of callers who hang up before reaching an agent
- First Call Resolution (FCR) — whether the caller's issue gets resolved in a single contact
When ASA rises, longer waits drive more abandoned calls. Those callers call back, adding volume to an already strained queue. According to ICMI, service level is a more stable and representative metric than ASA alone. ASA averages can obscure the full distribution of wait times and don't account for callers who abandon before being answered.
How to Calculate ASA in a Call Center
The formula itself is simple:
ASA = Total Waiting Time for Answered Calls ÷ Total Number of Answered Calls
The result is expressed in seconds.
Example:
| Variable | Value |
|---|---|
| Total answered calls | 300 |
| Total queue wait time | 9,000 seconds |
| ASA | 30 seconds |
What the Average Doesn't Tell You
That 30-second average contains a lot of hidden variation. Some callers were answered in 5 seconds. Others waited 90 seconds or more. If you only look at the average, you miss the tail — the callers who are waiting far longer than your ASA suggests.
Supervisors should review wait time distribution alongside the average. A histogram of wait times will show whether you have a narrow, consistent band or a wide spread with outliers that are generating abandonment.
ASA can also be calculated at the individual agent level, not just across the full team. This is useful for identifying agents who consistently have longer queue times linked to their own handle time — useful for coaching or workload decisions.
Why ASA Matters: The Real Impact on Your Call Center
Customer Satisfaction and Abandonment
Callers have a threshold. Once it's crossed, they hang up — and an abandoned call rarely just disappears. Research from Nextiva's 2025 Customer Patience Benchmark (surveying 400 people) found that 56% switch immediately to another support channel when their first choice fails, and 28% abandon the product or service entirely after a missed response window.
Those callbacks and channel switches add contact volume, which further strains the queue. Each abandoned call that returns as a repeat contact pushes wait times even higher — compressing the problem for every caller still in queue.
Agent Performance and Morale
High ASA also creates conditions that wear down agents. When customers have been waiting a long time, they arrive at the conversation already frustrated. Agents absorb that frustration before any issue is resolved, which can extend handle times and increase escalations.
SLA Compliance
For businesses in healthcare, insurance, and financial services, ASA isn't just an operational preference — it can be a contractual and regulatory requirement. Medicare Part D sponsors, for example, are required by regulation to answer 80% of incoming calls within 30 seconds after the IVR, maintain average hold times under 2 minutes, and keep disconnect rates at or below 5%.
Missing ASA targets in these environments carries real consequences: contract penalties, compliance violations, and reputational damage.
What Is a Good ASA Benchmark?
The figure cited most often is 28 seconds as an average across industries — published by sources including VoiceSpin and Observe.AI. Alongside it, the "80/20 rule" is the most widely referenced service level standard: answering 80% of calls within 20 seconds.
A few important caveats:
- Neither the 28-second figure nor the 80/20 standard comes from a single verified primary study with a published methodology. Both are widely repeated conventions, not mandated targets.
- SQM Group notes that only 16% of contact centers consistently meet the 80/20 standard — which tells you how aspirational that benchmark really is in practice.
Industry-Specific Variation
Observed data shows significant variation by sector:
| Sector | Approximate ASA | Source |
|---|---|---|
| Healthcare (scheduling) | ~27 seconds | 2024 HCCT Survey, 54 healthcare contact center leaders |
| Healthcare (clinical calls) | ~27 seconds | 2024 HCCT Survey |
| Social Security Administration | ~39 minutes | Official FY2024 government data |
| IRS (2024 filing season) | ~3.4 minutes | Taxpayer Advocate review |
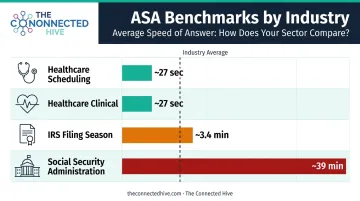
The government figures don't apply to most commercial operations. They do, however, underscore a key point: what counts as a "normal" ASA is almost entirely determined by your industry, staffing model, and call complexity — not a universal standard.
The Overstaffing Risk
Chasing a low ASA can backfire. If agents are answering calls in 3–5 seconds consistently, you likely have more staff on the floor than current volume justifies — and that excess capacity carries a real cost. The goal is an optimized ASA that balances caller experience against the actual cost of maintaining that response speed.
Key Factors That Affect Your Call Center's ASA
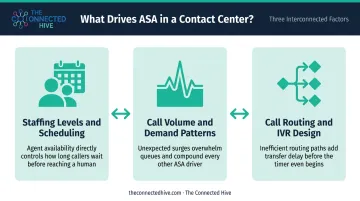
Three variables drive ASA more than anything else:
1. Staffing levels and scheduling The most direct lever. When call volume exceeds agent capacity, queues grow and ASA rises. The problem is usually concentrated in specific windows — Monday mornings, post-outage spikes, seasonal surges — rather than spread evenly across all hours.
2. Call volume and demand patterns Billing cycles, product launches, and unexpected service disruptions all create volume spikes. Without forecasting, contact centers are always reacting instead of preparing.
3. Call routing and IVR design A poorly structured IVR misdirects callers, inflating wait times for everyone. Good routing logic gets each caller to the right agent faster and filters out contacts that don't need a live agent at all.
Each of these factors compounds the others. A volume spike is manageable with adequate staffing; it becomes a crisis when routing is also inefficient.
How to Improve Your Call Center's ASA
Optimize Routing and IVR Design
Automatic Call Distribution (ACD) systems and skills-based routing reduce ASA by matching callers to capable agents faster, rather than defaulting to whoever is next available regardless of fit. When a caller reaches an agent who can actually resolve their issue, handle times drop. Shorter handle times mean agents free up sooner for the next caller.
IVR design matters here too. An IVR that handles simple requests through self-service (account balances, order status, appointment scheduling) removes those contacts from the live queue entirely, improving ASA for callers with more complex needs.
Use Call Forecasting and Smart Staffing
Historical call data can predict volume patterns by hour, day, and season with reasonable accuracy. That visibility lets managers schedule the right number of agents in advance rather than scrambling when queues spike.
The impact of getting forecasting right is substantial. A NICE case study of Alteram, a South African BPO, found that improving forecast accuracy by 74% and correcting an 8% call-volume under-forecast led to abandonment performance improving by more than 80%. Forecasting is one of the highest-leverage investments a contact center can make for sustainable ASA improvement.
Callbacks are a natural complement to better forecasting — they handle the gaps that even the best scheduling can't eliminate.
Implement Queue Callbacks
Callback options allow callers to opt out of holding and receive a return call when they reach the front of the queue. This doesn't technically reduce ASA — the wait time still exists — but it dramatically reduces abandonment during high-volume periods and improves the perceived experience for callers who would otherwise hang up.
Invest in Agent Training and Knowledge Resources
Agents who resolve issues faster spend less time per call, freeing them to answer the next caller sooner. Accessible knowledge bases, call scripts, and troubleshooting guides cut the time agents spend searching for answers mid-call, which brings down handle time and, by extension, ASA.
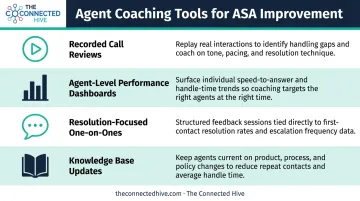
Ongoing performance coaching matters too. Supervisors who regularly review agent-level ASA and handle time data can identify specific patterns (not just team-wide trends) and address them directly. Targeted coaching tools worth putting in place include:
- Recorded call review sessions tied to specific ASA or handle time outliers
- Agent-level dashboards showing individual performance against team benchmarks
- Regular one-on-ones focused on resolution skills, not just speed metrics
- Knowledge base updates driven by recurring mid-call search patterns
Monitor ASA in Real Time and Act on the Data
A metric only improves when it's visible and someone is accountable for it. Real-time dashboards allow supervisors to spot ASA spikes mid-shift and reallocate resources — pulling agents from low-volume queues, activating overflow routing, or opening callback availability — before the queue becomes unmanageable.
Historical reporting is equally important. It reveals patterns: which hours consistently spike, which days of the week run lean, which campaigns drive unexpected volume. That data feeds back into forecasting and staffing decisions.
For businesses evaluating contact center partners or BPO vendors, a partner's reporting infrastructure deserves close scrutiny before signing. The Connected Hive's advisory process includes a structured review of prospective partners' technology stacks, staffing models, and performance reporting capabilities — covering WFM platforms, analytics tools, and the transparency of their real-time and historical data.
Businesses that skip this evaluation often discover reporting gaps after launch, when fixing them is far more costly.
Frequently Asked Questions
What is ASA in a call center?
ASA (Average Speed of Answer) is the average time a caller waits in queue before a live agent picks up. It's measured from when the caller enters the queue — not from when they first dial in — and excludes any time spent navigating IVR menus.
How do you calculate ASA in a call center?
Divide the total waiting time for all answered calls by the total number of answered calls. For example: 9,000 seconds of total queue wait across 300 answered calls equals an ASA of 30 seconds.
What is a good ASA benchmark for call centers?
The widely cited reference point is 28 seconds, paired with the 80/20 service level convention (80% of calls answered within 20 seconds). These are industry starting points, not universal mandates — the right target depends on your industry, call type, and customer expectations.
How does ASA differ from Average Handle Time (AHT)?
ASA measures only the pre-answer wait — time in queue before an agent connects. AHT measures the full interaction after connection, including talk time and after-call work. Both influence each other, but they measure entirely different phases of the customer contact.
Does a very low ASA always indicate good call center performance?
No. An unusually low ASA can signal overstaffing, meaning you're paying for agent capacity that exceeds actual demand. The goal is an optimized ASA — one that delivers a good caller experience without inflating cost per interaction.
What is the difference between ASA and Service Level?
ASA tells you the mean wait time across all answered calls. Service Level measures the percentage of calls answered within a set window — for example, 80% within 20 seconds. ICMI recommends service level as the more representative queue performance indicator, since averages can mask spikes in wait time.