Introduction
Picture this: a customer calls your support line, waits four minutes, then hangs up frustrated. They don't call back. They leave a review instead.
That scenario plays out thousands of times daily across call centers that aren't tracking — or aren't hitting — their service level targets. According to ContactBabel's 2024 research, 61% of consumers find not knowing their wait time extremely frustrating, and their perception of how long they've waited is dramatically worse than actual queue times.
That frustration is exactly what service level is designed to prevent. This metric tells you, in plain numbers, whether your call center has enough capacity to answer calls before customers give up — and when you're falling short, it tells you early enough to do something about it. Miss it consistently, and the damage to customer loyalty compounds quickly.
This guide covers the essentials: what service level means, how to calculate it, what "good" looks like across industries, and how to improve it when you're falling short.
Key Takeaways
- Service level measures the percentage of calls answered within a target time window, expressed as a ratio like 80/20
- The 80/20 standard is a widely recognized convention — not a regulatory requirement — and targets vary by industry
- How you count abandoned calls in your formula must be consistent and spelled out in your SLA
- Service level alone doesn't indicate call center health; it must be tracked alongside FCR, AHT, and CSAT
- Consistent SLA failures typically point to staffing, forecasting, or partner-fit issues rather than technology alone
What Is Call Center Service Level?
Service level is defined as the percentage of inbound calls answered by a live agent within a specified time threshold. It's always expressed as two numbers — for example, 80/20 — where 80 represents the percentage of calls answered and 20 represents the time window in seconds.
So 80/20 means: 80% of all calls are answered within 20 seconds.
Service Level vs. Service Level Agreements (SLAs)
These two terms get used interchangeably, but they describe different things.
Service level is a single operational metric — a real-time snapshot of how quickly calls are being answered in a given period.
A Service Level Agreement (SLA) is a formal contract between a business and its call center or BPO partner. It encompasses multiple performance standards, not just answer speed. A well-structured SLA will define:
- The service level target (e.g., 85/20)
- How abandoned calls are counted in the formula
- Measurement intervals (half-hourly, daily, monthly)
- First call resolution, CSAT, and availability benchmarks
- Reporting requirements and escalation procedures
- Remedies and penalty clauses for non-compliance
Maryland's 2025 government contact center contract is a useful real-world example: it specifies 85% of calls answered within 20 seconds, a separate 100/30 threshold, ASA requirements, and explicit rules about which abandoned calls are excluded — all in a single contract schedule. That level of specificity is what separates a meaningful SLA from a vague performance promise.
Why Service Level Matters
Speed and resolution quality both shape customer satisfaction — and the data makes the stakes concrete. CFI Group's Contact Center Satisfaction Index measured the gap directly:
- Calls handled in 6–10 minutes scored 79 in satisfaction; calls over 30 minutes dropped to 51
- First-contact resolution produced a satisfaction score of 82; unresolved calls scored just 31
Those gaps compound when service level slips. Customers who abandon calls often don't return at all. Those who do come back frustrated, which strains agents, extends handle times, and pushes service level down further — a self-reinforcing cycle that's hard to reverse once it starts.
How to Calculate Call Center Service Level
The standard formula is straightforward:
(Calls answered within the target time ÷ Total calls received) × 100
So if 800 of 1,000 calls are answered within 30 seconds: 800 ÷ 1,000 × 100 = 80% service level.
The Abandoned Call Problem
Where it gets complicated is abandoned calls. Different call centers treat them differently, and the choice meaningfully changes your reported number.
| Method | How It Works | Effect on Reported SL |
|---|---|---|
| Count all offered calls | Abandons count against attainment | Strictest — most conservative |
| Exclude all abandons | Only handled calls in denominator | Inflates reported SL |
| Exclude short abandons | Remove calls disconnecting in 5–10 seconds | Moderate; requires exact cutoff definition |
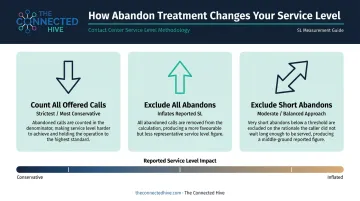
COPC, a leading contact center standards body, rejects the handled-calls-only approach and also cautions against excluding short abandons without a defined rationale. Their position: the denominator should include all offered calls.
Using the same data set but different abandon methods can shift your reported service level by 3–5 percentage points. That's why the formula — including the exact abandon treatment and time threshold — must be defined in the SLA before performance is ever measured.
Average Speed of Answer (ASA)
Service level tells you whether the threshold was met. ASA tells you how long callers actually waited.
ASA = Total wait time ÷ Total calls answered
ICMI defines ASA as total delay divided by total answered contacts. ContactBabel's 2025 guide reported an observed US ASA of 99 seconds in 2024 — not a target, but a useful industry benchmark.
ASA gives managers a more granular picture: a center can meet its 80/20 target while still having a high ASA, which suggests calls just inside the threshold are skewing the average upward.
Measurement Intervals Matter
Both ASA and aggregate reporting share the same blind spot: they can hide the real story. Monthly service level reports mask serious intraday failures — a center that overperforms Monday through Thursday can miss targets badly on Friday and still report a "healthy" monthly average.
COPC recommends daily or interval-based monitoring, particularly during peak volume windows. That's where service level problems actually surface — and where staffing adjustments can still make a difference.
Key monitoring practices:
- Track performance at daily or interval level, not monthly averages
- Flag peak volume windows for closer review
- Use intraday reports to trigger staffing action before the damage compounds
The 80/20 Standard: Industry Benchmarks and What "Good" Looks Like
The 80/20 benchmark — 80% of calls answered within 20 seconds — is the most widely cited standard in call center operations. Its origins aren't regulatory; it emerged as a pragmatic balance between staffing costs and reasonable customer wait times. No single governing body mandated it, and COPC explicitly notes that treating 80/20 as a universal standard is a misconception.
Benchmarks by Channel
| Channel | Common Target | Notes |
|---|---|---|
| Voice | 80% within 20 seconds | Widely recognized convention |
| Live chat | 80% within 20 seconds | Similar patience threshold to voice |
| 100% response within 24 hours | Response time, not a queue SLA | |
| 9-1-1 PSAPs | 90% in 15 sec / 95% in 20 sec | NENA emergency standard — not applicable to commercial centers |
How Targets Vary by Industry and Urgency
There's no single "right" service level target. What's appropriate depends on call urgency, customer expectations, and regulatory requirements specific to the program.
- Healthcare enrollment lines (e.g., Medicare Part C/D): CMS monitoring specifies average hold times of 2 minutes or less and a disconnect rate of 5% or less — program-specific requirements, not universal healthcare benchmarks
- Emergency services: NENA standards require 90% of calls answered within 15 seconds for public safety answering points — a very different context from commercial call centers
- Government contracts: Maryland's 2025 task order required 85/20 and 100/30 — stricter than the generic 80/20 convention
- General customer service: Many centers operate near 80/20 as a baseline, adjusting for peak periods and queue type
Businesses with tiered customer segments — such as VIP account holders versus standard customers — often maintain separate queues with different SLA targets to reflect those differences in expected service.
That complexity matters when evaluating a BPO partner. The right question is whether a vendor can hit the target your specific program requires — not just 80/20 in the abstract. The Connected Hive's vendor matching process addresses this directly, connecting businesses with vetted BPO partners who have documented performance track records in the relevant vertical: healthcare, financial services, insurance, and government.
Key Metrics That Work Alongside Service Level
Service level measures speed. But speed alone doesn't tell you whether your call center is actually working well.
A center can technically meet an 80/20 target by rushing agents through calls — but that pushes first call resolution rates down and drives customers to call back, which ultimately undermines the service level it was trying to protect.
The Core Companion Metrics
| Metric | What It Measures | Benchmark Reference |
|---|---|---|
| Average Handle Time (AHT) | Total time per call (talk + hold + wrap-up) | ContactBabel reports 2024 mean call durations of 423 sec (service) and 513 sec (sales) |
| First Call Resolution (FCR) | % of issues resolved without a callback | SQM places the North American industry average just under 70% |
| Call Abandonment Rate | % of callers who hang up before reaching an agent | COPC guidance: 3–5% acceptable; ContactBabel observed 8.9% in 2024 |
| CSAT | Customer satisfaction with the interaction | CFI Group's 2022 CCSI reported an average score of 69 on their index |
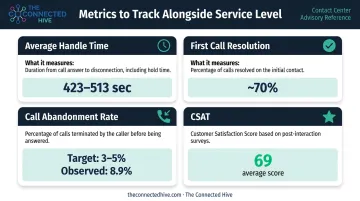
Use 3–5% abandonment as your planning target. The 8.9% many centers actually hit represents meaningful room for improvement — and a concrete goal to work toward.
Track These Together
An 80/20 service level with 8.9% abandonment and 55% FCR describes a very different operation than 80/20 with 3% abandonment and 75% FCR. The number alone doesn't reveal which one you're running. Review all four metrics together — on the same reporting cadence — to get an accurate picture of call center health.
What Factors Affect Call Center Service Level?
Volume Spikes and Seasonality
The most immediate threat to service level is demand that outpaces staffing. ICMI research found that 47% of contact centers experience peak volume between October and December — but predictable surges appear across many industries year-round:
- Healthcare: Open enrollment periods, plan year transitions
- Financial services: Tax season, quarterly reporting periods
- eCommerce/retail: Holiday shopping, flash sales, product launches
- Government: Benefits renewal cycles, crisis response events like FEMA activations
Without proactive workforce planning ahead of these windows, even a well-staffed center can see service level collapse within hours of a surge starting.
Agent Shrinkage and Turnover
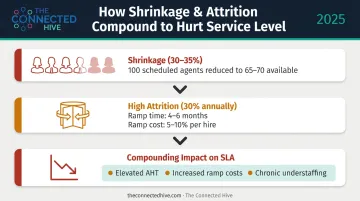
Shrinkage — the portion of scheduled time when agents are unavailable due to breaks, training, meetings, and absences — reduces the effective workforce by 30–35% based on practitioner data from Call Centre Helper. That means a center scheduling 100 agents effectively has 65–70 available for calls at any given time. Ignoring shrinkage in staffing models is one of the most common reasons centers underperform against their SLA targets.
High attrition compounds the problem. ContactBabel reported 30% mean US agent attrition in 2024, and McKinsey found that new hires require 4–6 months to reach peak proficiency. The operational cost shows up in three compounding ways:
- Elevated average handle time (AHT) during ramp-up slows queue clearance
- Ramp costs run 5–10% of total agent expense per new hire
- Chronic understaffing during transitions drags service level down across entire reporting periods, not just individual spikes
How to Improve Call Center Service Level
Forecasting, Scheduling, and WFM
The two most impactful levers are accurate forecasting and smarter scheduling. Using historical call volume data to model demand — accounting for shrinkage, peak periods, and seasonal patterns — is the foundation of any service level improvement plan.
Workforce Management (WFM) tools automate this process, replacing manual spreadsheet scheduling with data-driven staffing models. An ICMI survey of 362 centers found that 93.5% forecast inbound calls, and one respondent documented WFM helping move service level from 20% to a consistent 90%. That's an outlier result, but the direction is consistent: better forecasting means fewer surprise gaps.
Call Deflection and Self-Service
Every call that doesn't need to reach a live agent improves service level without adding headcount. Common deflection tools include:
- IVR systems — handling routine account inquiries, balance checks, or status updates automatically
- Chatbots and virtual agents — resolving common questions via digital channels around the clock
- Self-service portals — enabling customers to resolve issues without contacting support
- Callback options — removing customers from the queue without them hanging up (currently offered by 51% of surveyed centers)
One important caveat: Gartner research found that only 14% of customer service issues are fully resolved in self-service. Deflection tools reduce inbound volume, but failed self-service often generates a voice call anyway — sometimes a more frustrated one. Measure completed resolutions, not just deflection rates.
When the Problem Is the Partner
Persistent SLA misses despite operational improvements often point to a partner problem, not a process problem. Businesses regularly arrive with a vendor that looked good on paper but can't sustain targets under real operating conditions — due to scalability limits, workforce instability, or inadequate WFM infrastructure.
This is where The Connected Hive's CX consulting and vendor matching services come in. The assessment starts with whether the current arrangement can be restructured, then identifies a better-matched BPO from a network of 3,500+ domestic contact centers if needed. For regulated industries (healthcare, financial services, insurance, government) where SLA failures carry compliance implications, finding the right fit matters even more.
Frequently Asked Questions
What is a service level in a call center?
Service level is the percentage of inbound calls answered by a live agent within a defined time threshold, expressed as paired numbers (e.g., 80/20). It's the primary measure of whether a call center has enough capacity to meet customer demand in real time.
What is 80/20 service level in a call center?
80/20 means 80% of all calls are answered within 20 seconds. It's the most widely recognized baseline for voice-based call centers, though it's a convention, not a regulatory requirement. Actual targets vary by industry, urgency, and customer segment.
What is the difference between service level and an SLA?
Service level is a single metric tracking call answer speed. An SLA is a formal contract that encompasses multiple performance standards — including service level, FCR, CSAT, availability, and penalty terms — and defines accountability between a business and its call center provider.
How do service level targets differ by industry?
Regulated programs like Medicare Part C/D specify hold time and disconnect limits, while emergency services (NENA standards) require 90% of calls answered within 15 seconds. Commercial industries vary widely based on call urgency, customer expectations, and contractual requirements.
What happens when a call center fails to meet its service level targets?
Consequences include SLA penalty clauses, financial credits or damages, required performance improvement plans, and damage to customer satisfaction scores. Repeated or chronic failures can trigger contract termination rights for the client.
How often should service level be measured and reviewed?
Day-to-day management requires real-time or interval-based monitoring to catch intraday gaps as they happen. Formal SLA reviews should occur monthly or quarterly, with annual reassessments to confirm targets still align with current volume and customer expectations.